Excel
Even after all of these years, I feel like Excel is still one of the most effective ways to store and manipulate small scale data. I’ve used Excel for all sorts of trending, and with its VBA abilities, it’s a pretty robust toolbox.
Graphing data for displaying simple trends
Cleaning submissions from doctors and hospitals, transforming the data into usable chunks
Cleaning and manipulating data retrieved from pre-scripted queries
Building numerous spreadsheets designed to track date information for items such as training due dates and product stability testing submissions based on product type, international regulatory requirements, and so on.
Designing pivot tables for displaying drill-downs
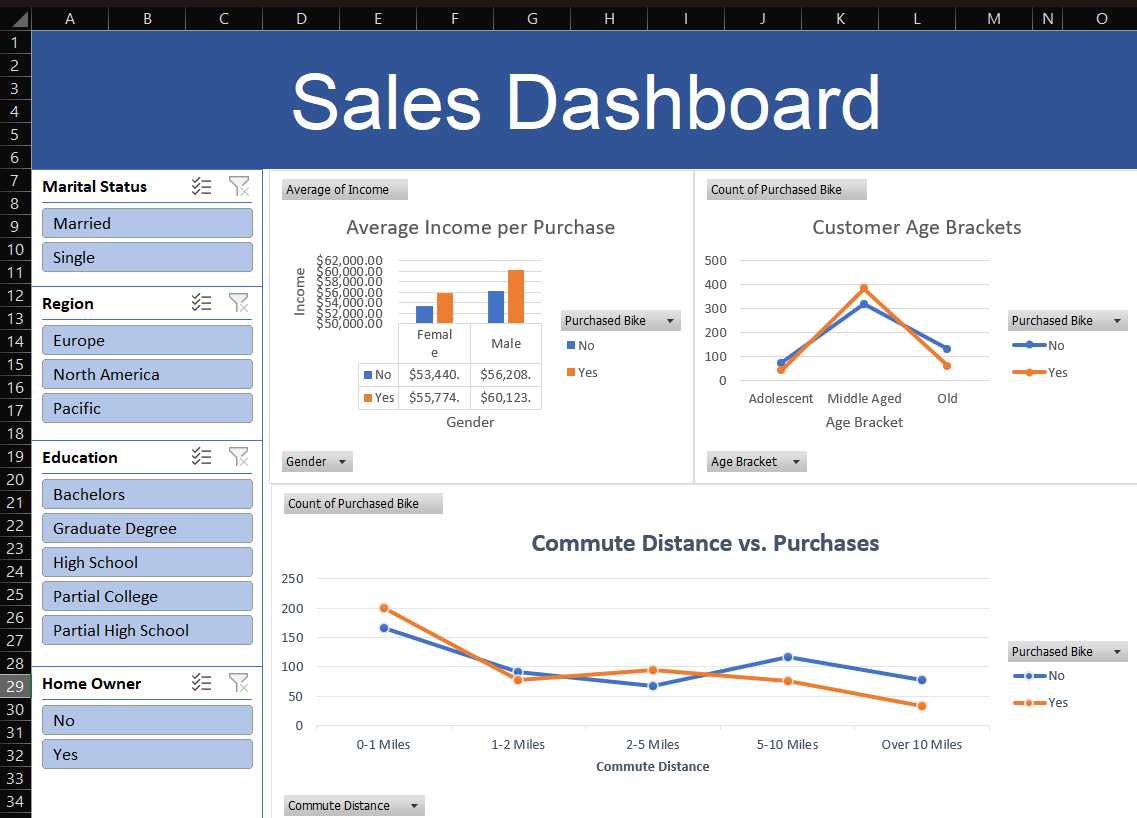
Combining graphs and splicers to create detailed dashboards
Use of VLOOKUP and XLOOKUP
Microsoft Access - Tristero
When I was at Jeunesse, Thursdays were report days for the Quality team.
Now for me, that was no big deal. All of my documentation was essentially testing reports from testing laboratories. I’d review it, verify it was complete and had passing results, and then pass it on to my boss. Other people on my team, however, were compiling customer complaint and verification testing data into reports. They usually spent around 3-5 hours each manually prepping these reports. They would also pass their reports onto our boss for final approval.
Unfortunately, if there was a transcription error the report was rejected, passed back to the originator who would have to track down the error and recreate the report.
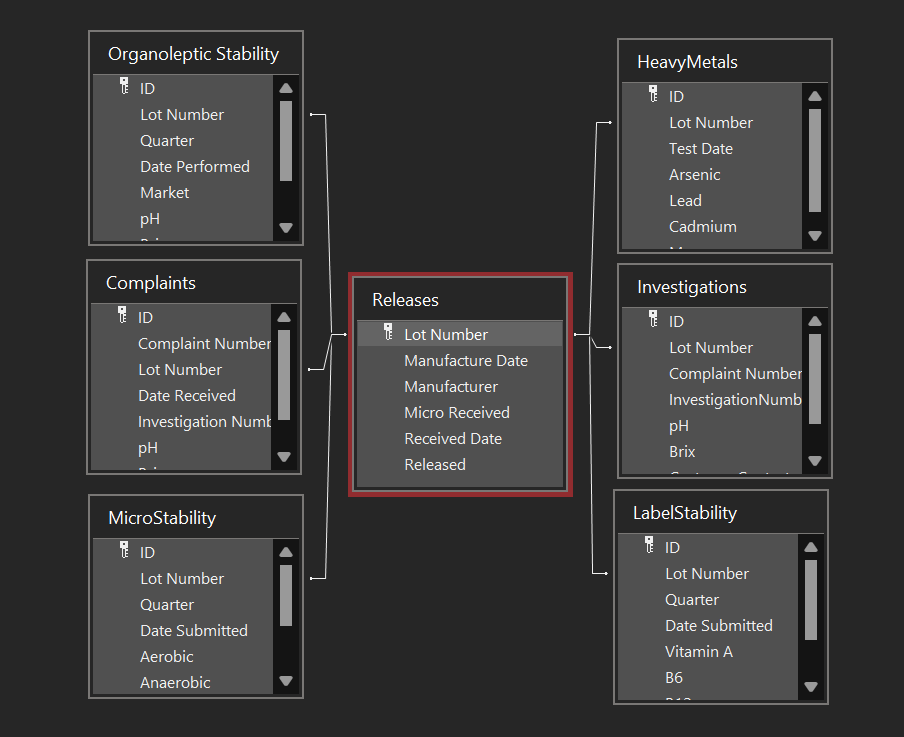
As we had Microsoft Access on our computers, I went to my boss and asked for permission to start looking into combining all of our team’s Excel sheets into one massive database. I got approval and that lunch break I headed to Barnes and Noble to grab an Access guidebook. Over the coming weeks I built a full relational database that utilized everyone’s work. My boss was in charge of product releases, so I imported her Excel sheet and set the product lot number as the Primary Key. All other tables would check the lot number off of that PK. If the lot number wasn’t in the Releases table, it was rejected. Transcription errors were eliminated almost immediately. I added a simple GUI with security access protection to ensure people didn’t accidentally overwrite other’s work and didn’t have to figure out how to navigate the tables directly.
Even better, I was able to automate all of the reports - weekly, quarterly, and annual reports could be generated at the press of a button (you’d just have to provide the date range) and exported into Word for quick printing. Graphs were also added, complaint rate trending, and even the ability to track data for skip-lot testing, which helped save the department millions in testing costs.