The Great Taco and Burrito Locator
I got the idea to build this dashboard after a friend sent me a link to a Kaggle dataset covering Mexican restaurant menus across the US. I had wanted to create a project utilizing Tableau’s geography abilities, and this seemed to be a perfect fit.
What I didn’t expect was the data set to be so messy. A lot of redundancy, incomplete data that couldn’t be organized properly, and incorrect latitude and longitude information. Unless there’s an abundance of sea-based taco carts about 300 miles north of the Azores. It also had data for catering information so while I dream about ordering $150 worth of tacos, it didn’t seem practical.
I managed to include elements in the dashboard that tell you the most and least expensive menu items in the data. Clicking on a location on the map brings up the restaurant information, along with the taco and burrito-based menu items on the right. Alternatively, you can scroll through all of the menu items on the right side, and clicking on an item will take you to the restaurant on the map!
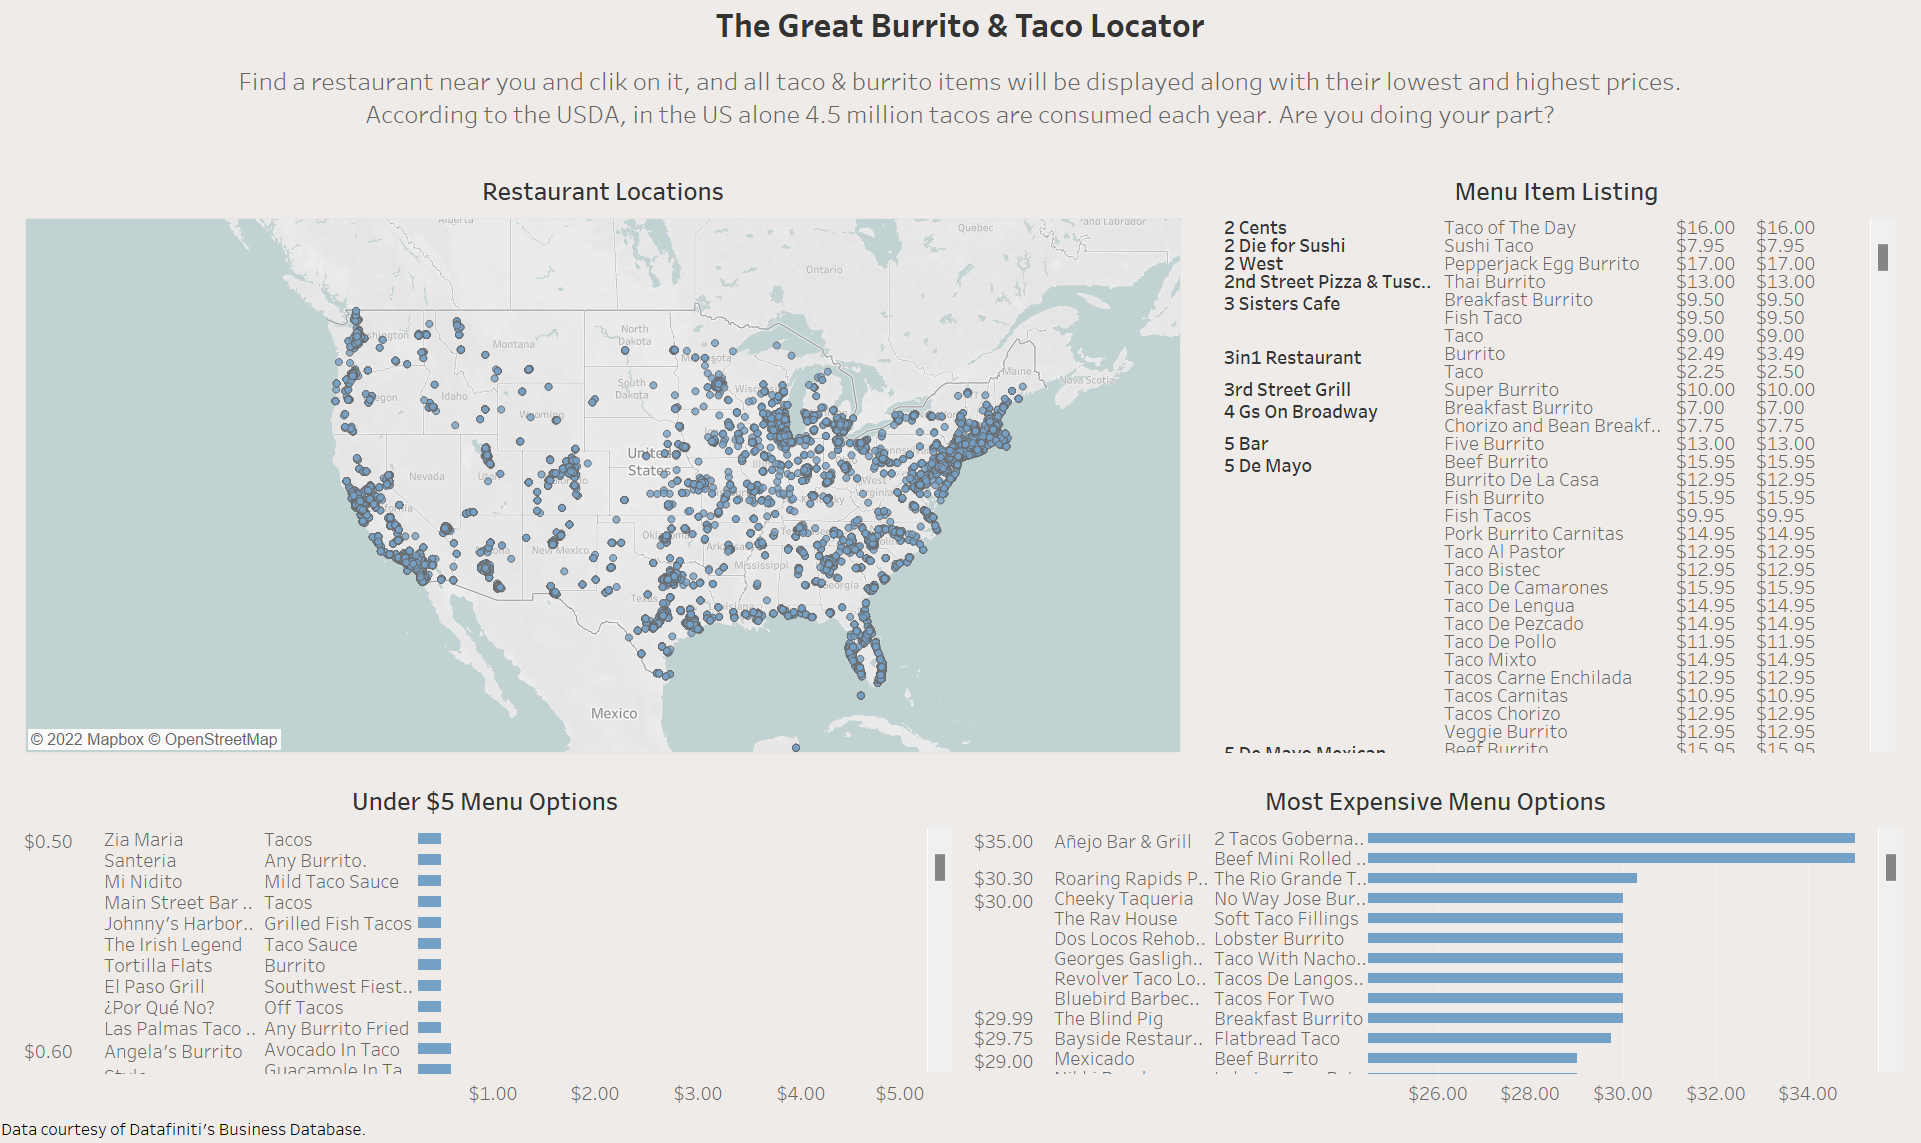
The main dashboard for The Great Taco and Burrito Locator.
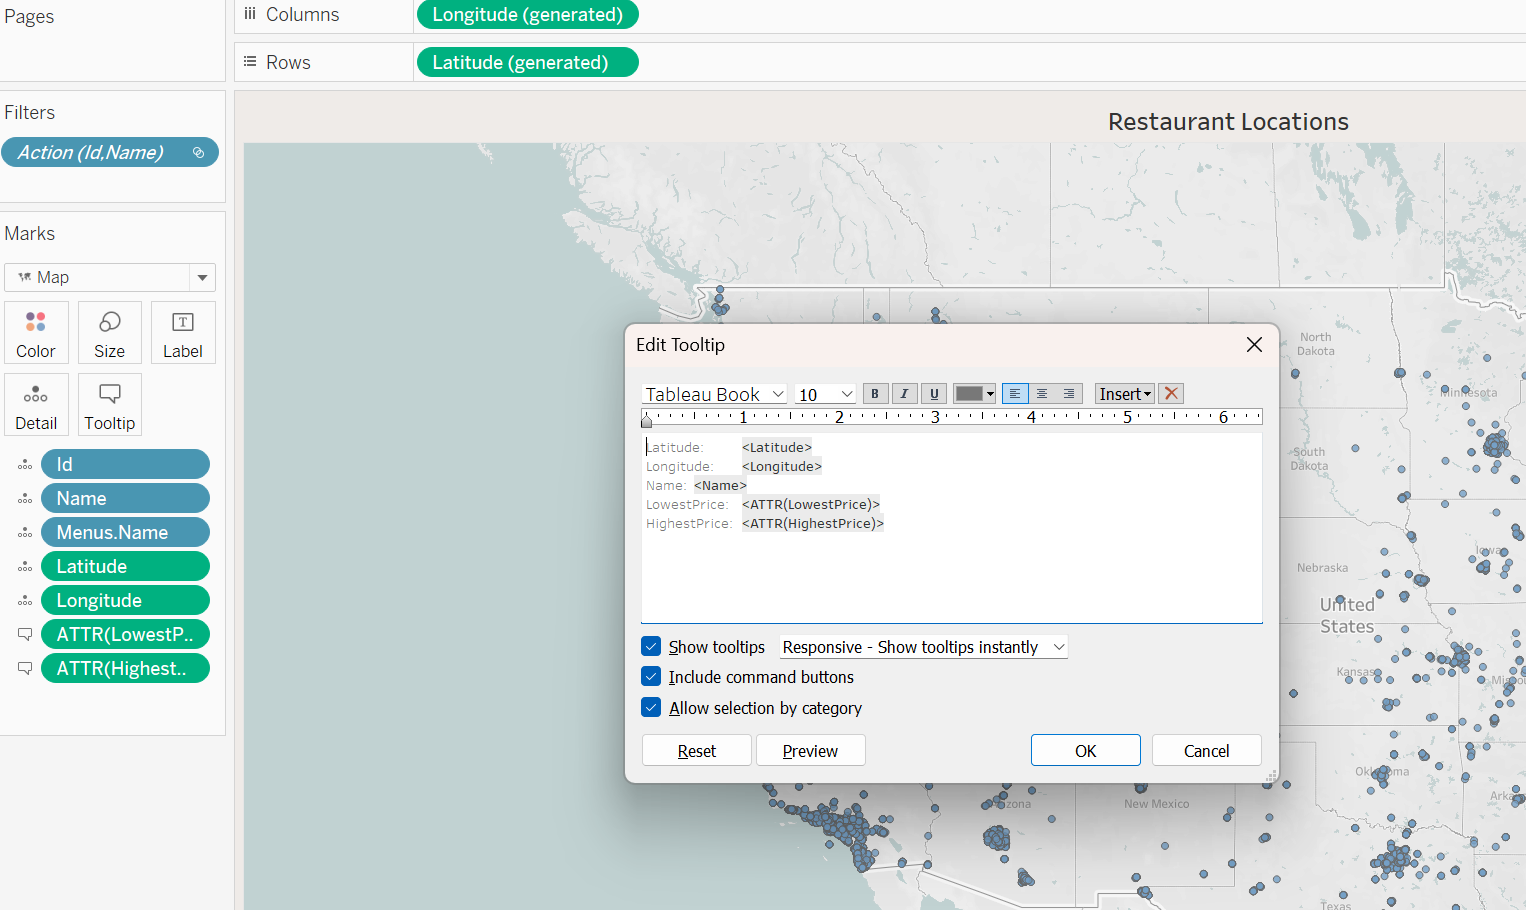
The map worksheet.
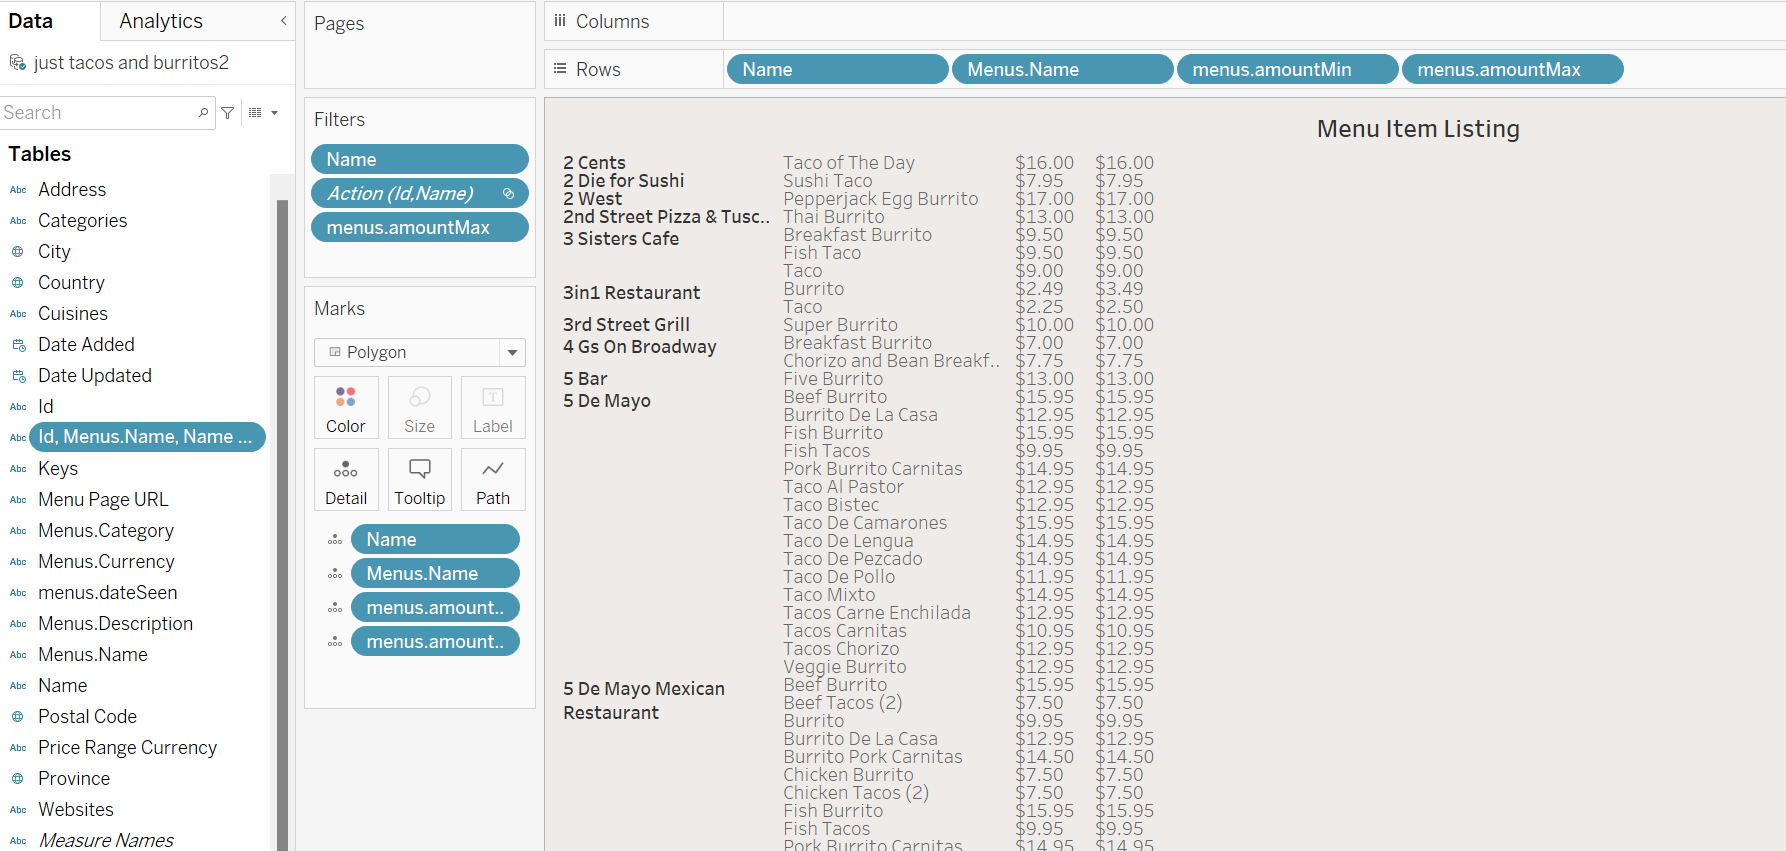
The menu listings sheet, grouped by restaurant.
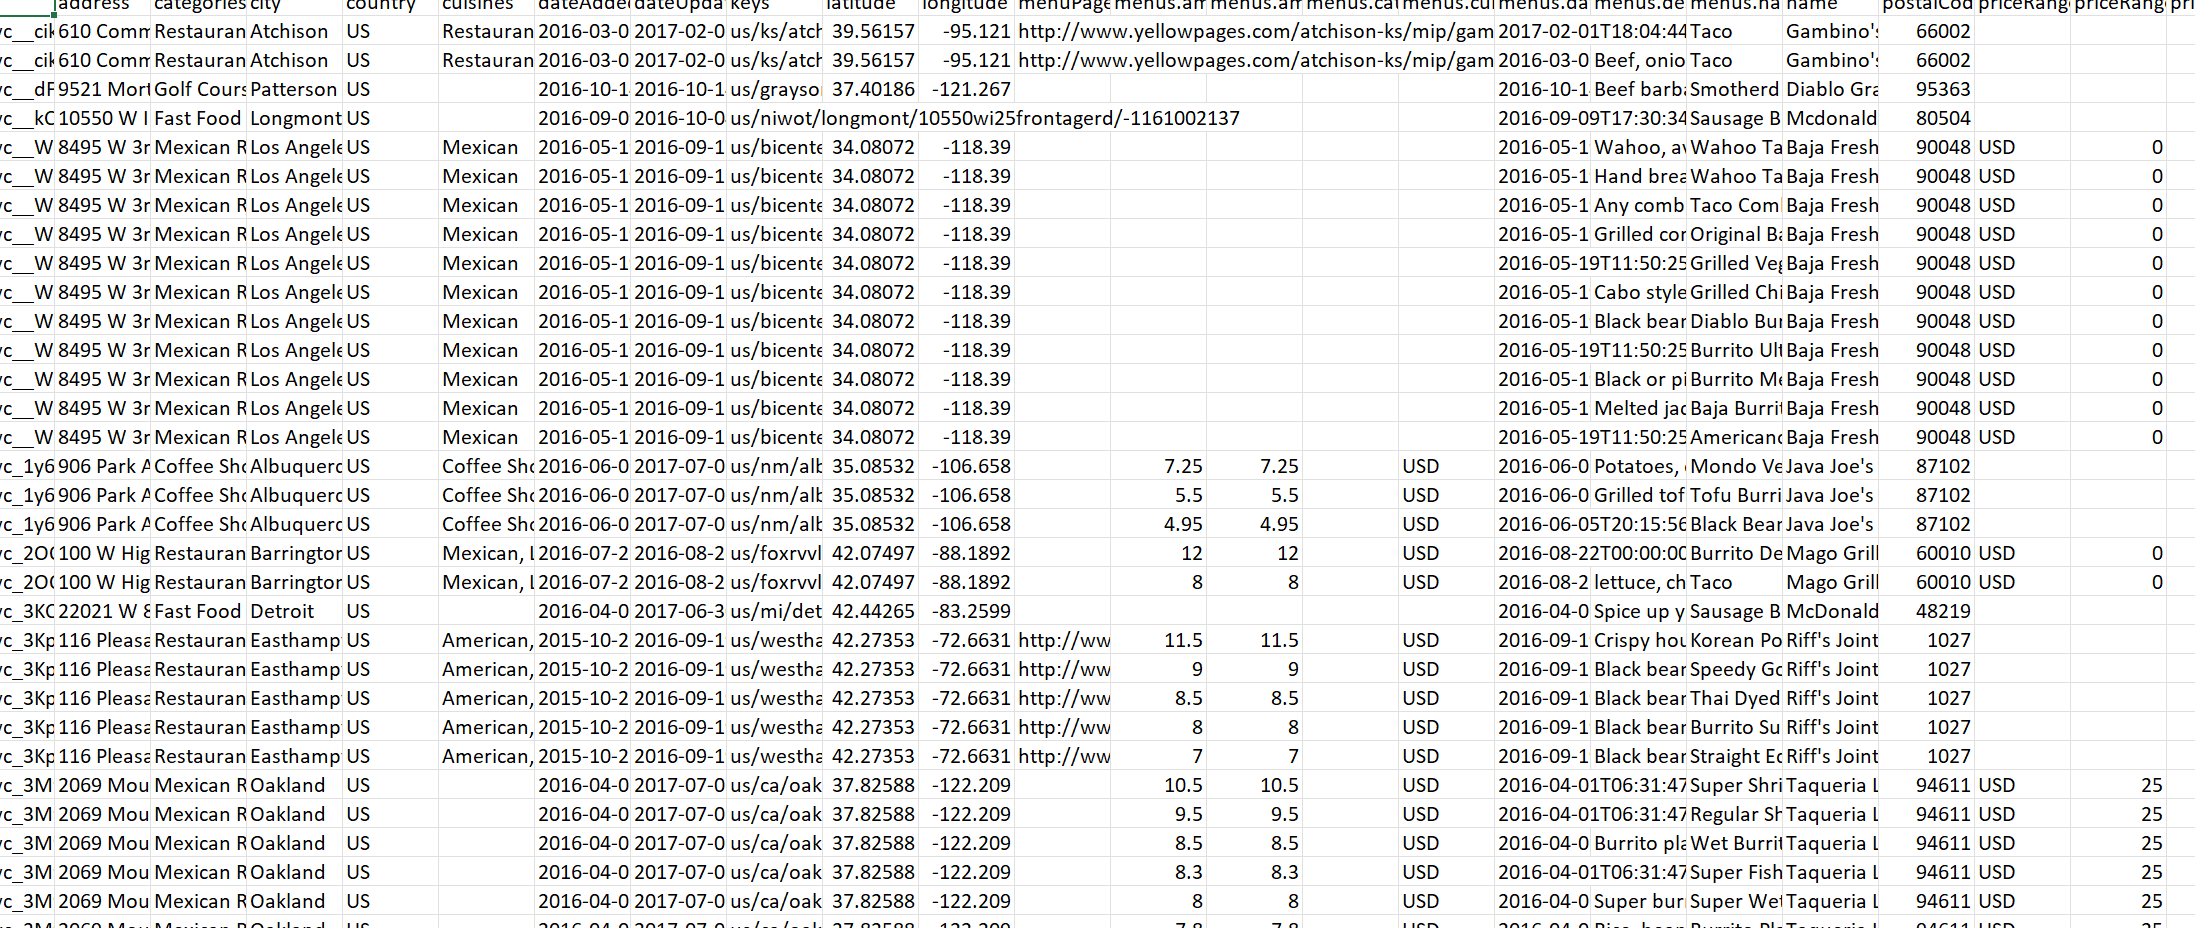
The raw data.