Long John, Get Down!
Long John, named after Treasure Island’s one-legged villain Long John Silver, is essentially my shadow. No matter where I am, he’s always close or directly on my lap. However, he’ll cause trouble to get attention if he feels ignored. His favorite thing is to climb on furniture. For a few weeks I decided to log the data and build a dashboard for it.
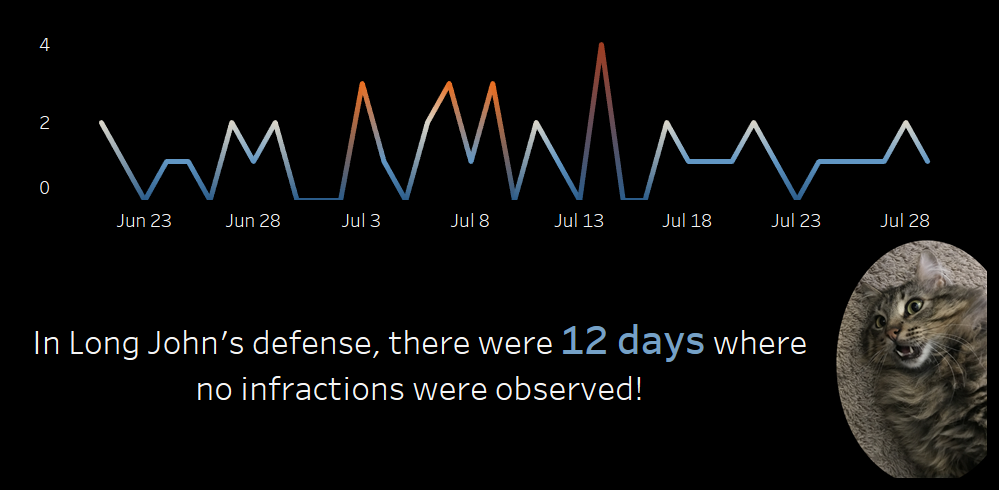
Part of the reason for this dashboard was to try two things - using a dark dashboard theme and creating visuals out of very small data sets. My last project was the Great Taco and Burrito locator which was a behemoth. It was an interesting change to present on such a narrow scope. Overall, I like the scope of this as it clearly presents exactly what’s being measured. Near the bottom of the dashboard, the Total Infractions graph shifting to red lets the reader know that Long John got into A LOT of trouble on those days.
Ultimately, I’d say I learned a lot. Long John, not so much.
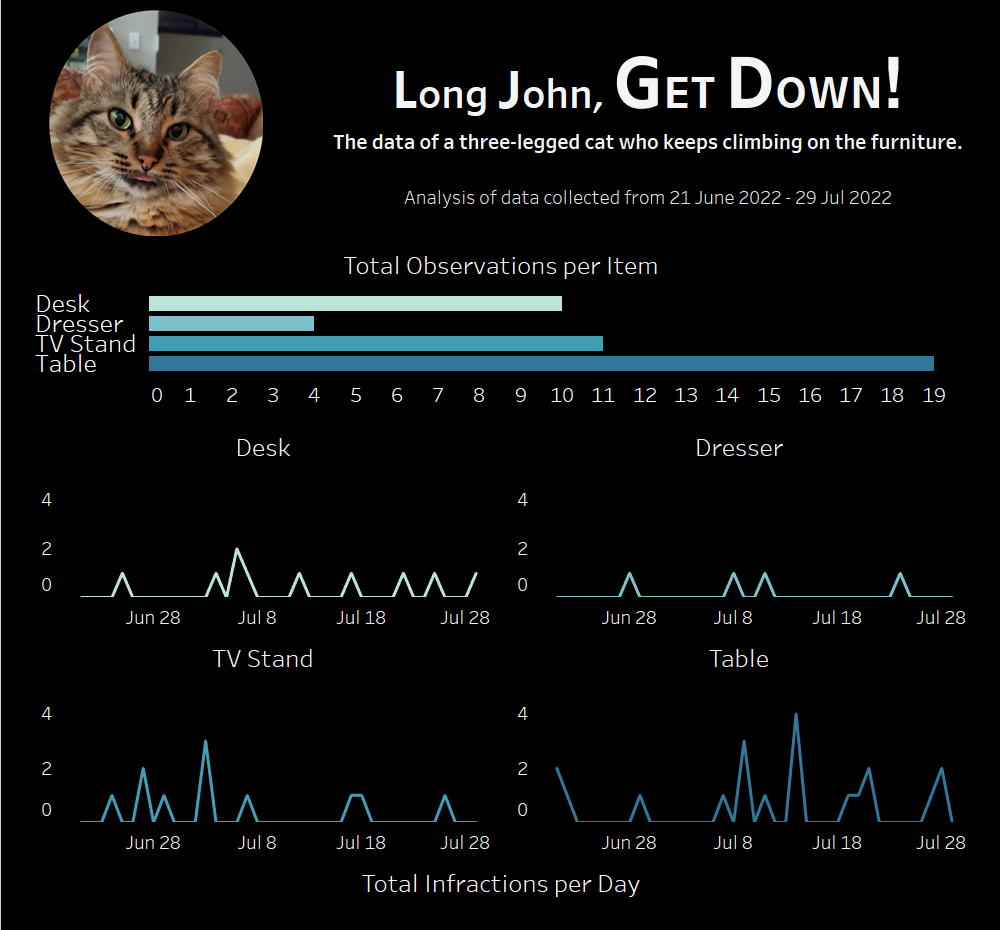
Here I’ve presented the information gathered in a bar chart, with line graphs tallying the number of infractions/day.
For this last section, I added a gradient to the line graph, with the color shifting to red the higher the observed infractions.